We have integrated JBrowse to show different data types of annotation data, such as BED, GFF3, BigWig, BAM and so on.
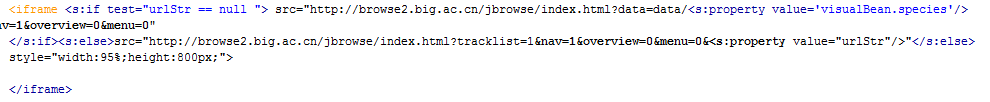
When users deploy this function on own HPC cluster environment, they need to install the JBrowse at cluster header node or a single machine firstly, and then modify the visual_page.jsp under visual folder. Set the JBrowse link to the real access URL. For those users who deploy JBrowse on a single machine, they can use a proxy mode to get the data from HPC cluster.
6.1 Visualization List
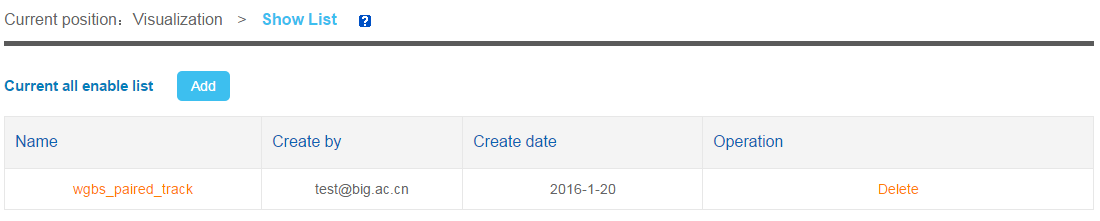
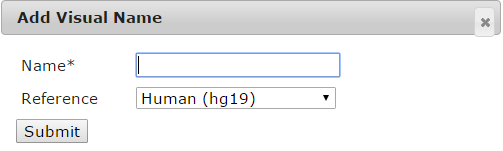
6.2 Add a visual page
When user click "Add" button, a page will be showed. User need to fill a name and choose the species.
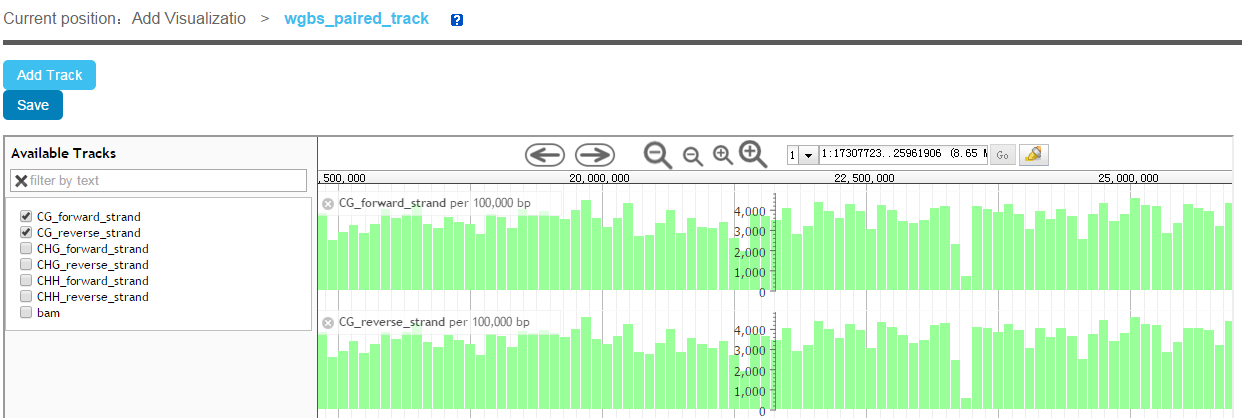
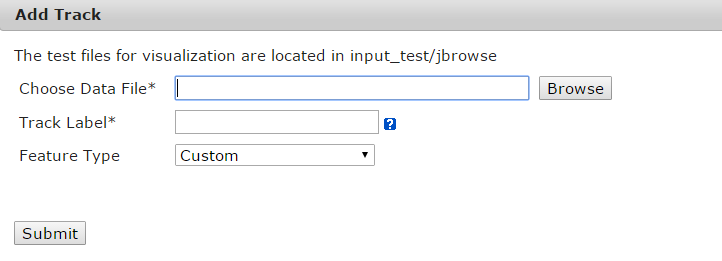
Then, a JBrowse page will be showed. User can click "Add Track" to open web page. Choose the track data file from the four data spaces, fill the track label and then choose a feature type, when click submit, a JBrowse page with track label will be showed. Currently, we support several features types such as Gene, BAM, SNP, BigWig XYplot, Wiggle Density and Custom. The custom type will be showed the track as a custom rectangle.